前端远程调试
背景
由于有些时候不方便到用户实地/远程桌面复现 bug,需要远程查看对方网页的控制台,经过预研发现远程调试工具 page-spy-web 比较合适
实现
-
在开发机(由于开发只能完全控制开发机,同时要保证此开发机能被下面的前端服务器访问)上部署一个 docker 镜像
docker run -d --restart=always -p 6752:6752 --name="pageSpy" ghcr.io/huolalatech/page-spy-web:latest -
通过特定域名(可以自定义域名后缀,配合下面的前端服务器),配置 nginx 转发到此开发机
server { listen 80; server_name *.你的对外域名后缀(和前端域名保持一致后缀); access_log /var/log/nginx/access.log main; proxy_read_timeout 240s; location / { proxy_http_version 1.1; proxy_set_header Upgrade $http_upgrade; proxy_set_header Connection "Upgrade"; proxy_set_header Host $host; proxy_pass http://localhost:6752; } } -
由于前端服务器需要能访问到开发机,所以需要在前端服务器对应的 nginx 做转发,这里配置到前端域名的子路径,参考步骤
server { location /pagespy/ { # 这里请求转发到开发机,同时由于开发机的 nginx 配置的和前端域名一致,所以能成功转发到开发机对应的 pagespy 服务 rewrite ^/pagespy/(.*)$ /$1 break; proxy_pass http://开发机对外ip; proxy_http_version 1.1; proxy_set_header Upgrade $http_upgrade; proxy_set_header Connection "upgrade"; proxy_set_header Host $host; proxy_set_header X-Real-IP $remote_addr; proxy_set_header X-Forwarded-For $proxy_add_x_forwarded_for; } location /pagespy { return 301 $scheme://$host$request_uri/; } } -
修改前端代码主入口适配远程调试
src/utils/index.js
// 异步加载单个脚本
async function loadSingleScript(src, options) {
  return await new Promise((resolve, reject) => {
     // 这里未考虑到同一 src 同时发起的情况,改用缓存实现
     // if (!id) {
     //   const NAMESPACE = 'c2b16a16-12b3-423a-879f-6b46d1a01d60'
     //   const PREFIX = 'script-id-'
     //   id = PREFIX + uuidv5(src, NAMESPACE)
     // }
     // if (!src || document.querySelector(`#${id}`)) {
     //   return
     // }
     const script = document.createElement('script');
     const { attributesMap = {}, ...rest } = options;
     Object.keys(rest).forEach((key) => {
        script[key] = rest[key];
     });
     Object.keys(attributesMap).forEach((key) => {
        script.setAttribute(key, attributesMap[key]);
     });
     script.async = true;
     script.src = src;
     script.onload = resolve;
     script.onerror = reject;
     document.getElementsByTagName('head')[0].appendChild(script);
  });
}

// 异步加载多个脚本
// memoize 默认情况下用第一个参数作为缓存的 key,即 src
export const loadScript = memoize(loadSingleScript);
src/index.js
import { loadScript } from './utils';

async function loadScriptFunc() {
  // 这里使用别名访问 pagespy 服务
  await loadScript('/pagespy/page-spy/index.min.js', { attributesMap: { crossorigin: 'anonymous' } });
  if (!window.PageSpy) {
     return;
  }
  window.$pageSpy = new window.PageSpy({
     api: window.location.host + '/pagespy',
     clientOrigin: window.location.origin + '/pagespy',
     project: window.location.host,
     title: window.localStorage.getItem('simUsername') || 'anonymous'
  });
}

const is_debug = new URLSearchParams(window.location.hash.split('?')[1]).get('is_debug');

if (process.env.NODE_ENV === 'production' && is_debug) {
  loadScriptFunc();
}
效果
- 让需要调试的远程页面加上
?is_debug=1参数,可以看到左下角进入待调试状态,点击左下角按钮然后点击 copy 复制出来待调试的远程链接,如果不方便让用户复制,转步骤 2

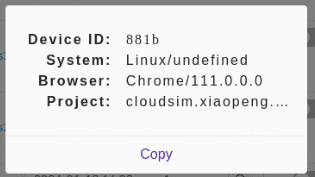
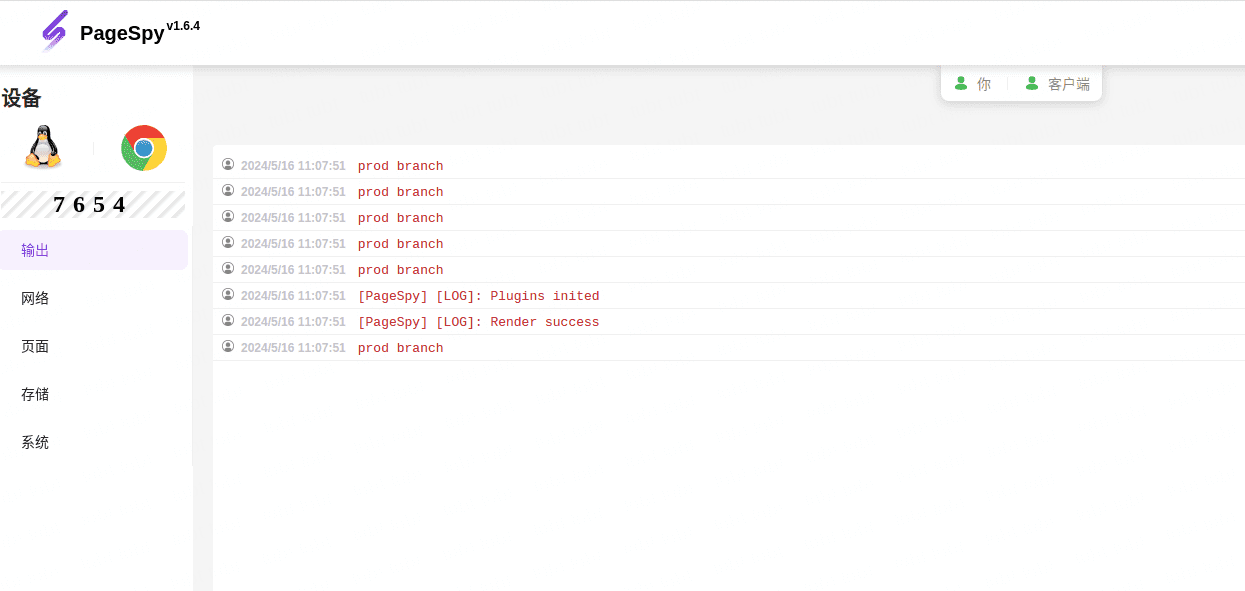
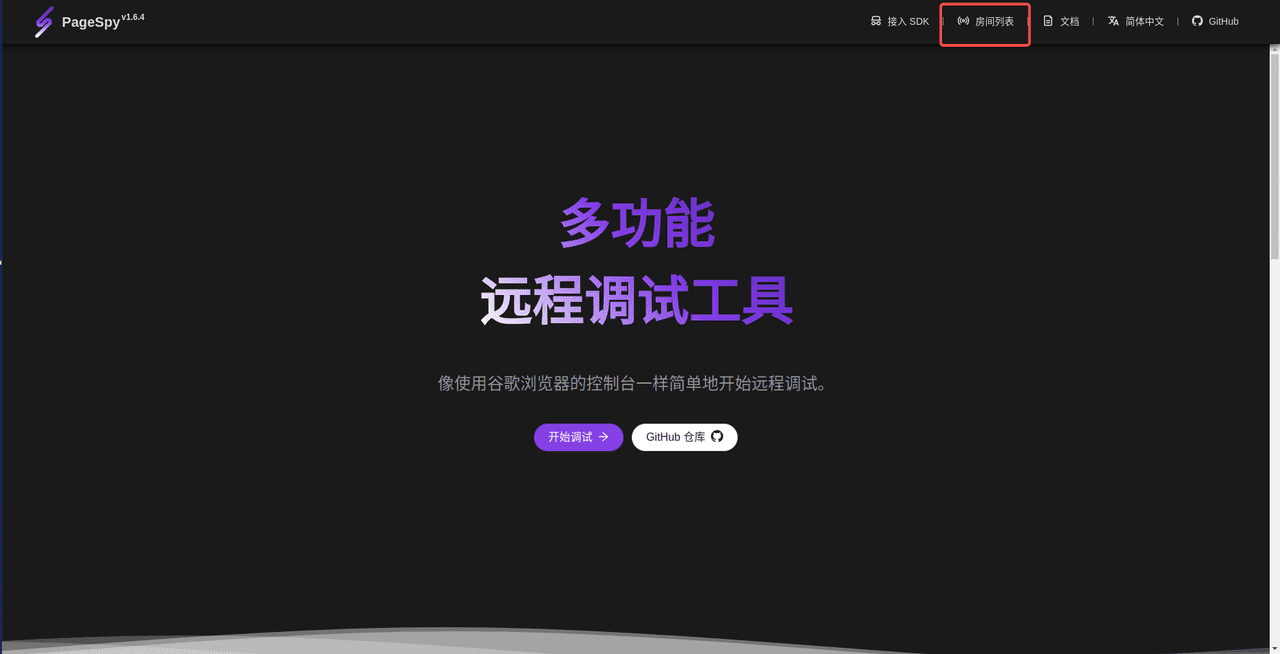
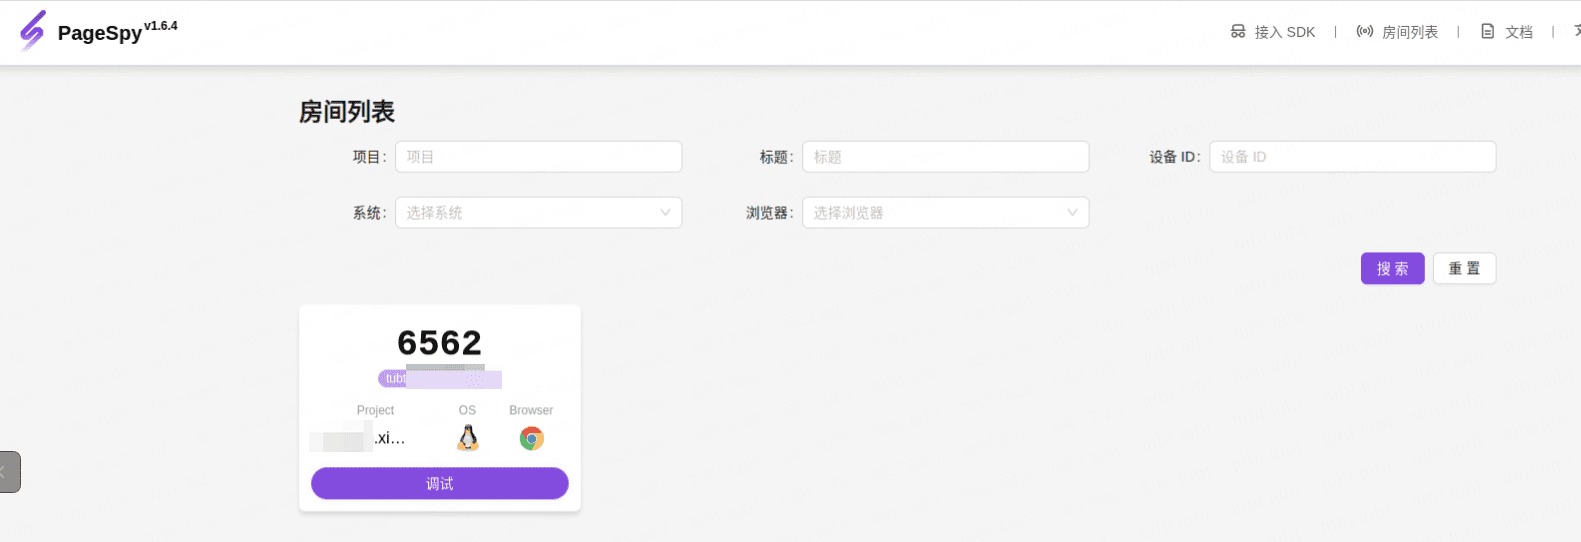
- 进入调试界面,网址为前端域名加上 /pagespy/,找到对应的项目/用户名/设备号(设备号可让用户截图发过来避免调试错误页面的情况)进入房间列表去调试
后端调试
背景
对于 python 后端框架,在内部逻辑有执行 orm 或 原生 sql 的接口的过程中不知道具体执行了什么 sql,需要有一个调试工具能展示
django
针对后端使用的 Django 3.1 以及 python 3.6 版本,预研发现只有 django-debug-toolbar,django-silk 符合要求
实现
django-debug-toolbar + django-silk
-
安装依赖库
Dockerfile-local
RUN python3.6 -m pip install django-silk==4.2.0 django-debug-toolbar==3.1.1 ipython pyflame git+https://github.com/towavephone/django-debug-toolbar-mongo.git@v0.3 -
修改启动脚本,挂载 tmp 目录
deployment/local/start.sh
-v /tmp:/tmp -
修改本地配置
local.json
{ "debug": true, "debug_tools": ["django-debug-toolbar"] } -
修改 setting.py
settings.py
DEBUG = __config.get('debug', False) DEBUG_TOOLS = __config.get('debug_tools', []) if DEBUG: if 'django-silk' in DEBUG_TOOLS: SILKY_META = True SILKY_PYTHON_PROFILER = True SILKY_PYTHON_PROFILER_BINARY = True def request_func(request): # 过滤掉 debug toolbar 的请求 return not (request.path.startswith('/__debug__') or request.path == '/') SILKY_INTERCEPT_FUNC = request_func MIDDLEWARE += [ 'silk.middleware.SilkyMiddleware', 'entry.middleware.SilkProfileAllViewsMiddleware' ] INSTALLED_APPS += [ 'silk' ] if 'django-debug-toolbar' in DEBUG_TOOLS: MIDDLEWARE += [ 'debug_toolbar.middleware.DebugToolbarMiddleware' ] INSTALLED_APPS += [ 'debug_toolbar', 'pympler', 'debug_toolbar_mongo', 'pyflame' ] INTERNAL_IPS = [ "127.0.0.1", "localhost" ] def custom_show_toolbar(request): # 路径为 /debug,即显示 silk 时候不需要显示 debug toolbar from debug_toolbar.middleware import show_toolbar return show_toolbar(request) and not request.path.startswith("/debug") DEBUG_TOOLBAR_CONFIG = { 'SHOW_TOOLBAR_CALLBACK': custom_show_toolbar, } DEBUG_TOOLBAR_PANELS = [ 'debug_toolbar.panels.history.HistoryPanel', 'debug_toolbar.panels.sql.SQLPanel', 'debug_toolbar_mongo.panel.MongoDebugPanel', 'debug_toolbar.panels.timer.TimerPanel', 'pympler.panels.MemoryPanel' , 'pyflame.djdt.panel.FlamegraphPanel', 'debug_toolbar.panels.versions.VersionsPanel', 'debug_toolbar.panels.settings.SettingsPanel', 'debug_toolbar.panels.headers.HeadersPanel', 'debug_toolbar.panels.request.RequestPanel', 'debug_toolbar.panels.staticfiles.StaticFilesPanel', 'debug_toolbar.panels.templates.TemplatesPanel', 'debug_toolbar.panels.cache.CachePanel', 'debug_toolbar.panels.signals.SignalsPanel', 'debug_toolbar.panels.logging.LoggingPanel', 'debug_toolbar.panels.redirects.RedirectsPanel', 'debug_toolbar.panels.profiling.ProfilingPanel', ] PYFLAME_CONFIG = { # https://gitlab.com/living180/pyflame # 默认值 None 告诉 pyflame 使用环境变量 PATH 搜索 Flamegraph.pl 'FLAMEGRAPH_SCRIPT_PATH': '/root/third_party/flamegraph.pl', } # mongo toolbar 每个操作的最大显示数量 DEBUG_TOOLBAR_MONGO_MAX_OPERATION_SIZE = 20 if DEBUG and 'django-silk' in DEBUG_TOOLS: MEDIA_ROOT = '/tmp' -
修改中间件以便让 silk 测量每个接口的性能
middleware.py
class SilkProfileAllViewsMiddleware: def __init__(self, get_response): self.get_response = get_response def __call__(self, request): response = self.get_response(request) return response def process_view(self, request, view_func, view_args, view_kwargs): from silk.profiling.profiler import silk_profile return silk_profile(name=request.path)(view_func)(request, *view_args, **view_kwargs) -
修改 urls.py,暴露调试地址
urls.py
if settings.DEBUG:
  # https://github.com/jazzband/django-debug-toolbar/blob/3.1.1/docs/installation.rst
  # https://github.com/jazzband/django-debug-toolbar/blob/3.1.1/docs/configuration.rst
  if 'django-debug-toolbar' in settings.DEBUG_TOOLS:
     import debug_toolbar
     urlpatterns += [
           re_path(r'^__debug__/', include(debug_toolbar.urls)),
     ]

  # https://github.com/jazzband/django-silk/tree/4.2.0
  if 'django-silk' in settings.DEBUG_TOOLS:
     urlpatterns += [
           re_path(r'^debug/', include('silk.urls', namespace='silk'))
     ]
else:
  urlpatterns += [
     re_path(r'', root_router)
  ]
vscode debugger
-
安装依赖库
Dockerfile-local
RUN python3.6 -m pip install debugpy==1.5.1 -
首次启动时打开调试端口,local.json 及 setting.py 部分省略,不设置
DEBUG_PORT默认为 9999manage.py
from django.conf import settings if settings.DEBUG: # 这里只在第一次启动,防止热重载中断 debug if os.environ.get("RUN_MAIN") != "true": import debugpy debugpy.listen(("0.0.0.0", settings.DEBUG_PORT)) # debugpy.wait_for_client() print(f"Django debug started, port is {settings.DEBUG_PORT}") -
配置 vscode 调试面板
.vscode/launch.json
{
  "version": "0.2.0",
  "configurations": [
     {
        "name": "Run Django (Docker)",
        "type": "python",
        "request": "attach",
        "pathMappings": [
           {
              "localRoot": "${workspaceFolder}/后端代码位置/entry",
              "remoteRoot": "/root/entry"
           }
        ],
        "port": 9999,
        "host": "127.0.0.1"
     }
  ]
}
疑难点
django-debug-toolbar
- 需要找到适配 Django 3.1 以及 python 3.6 版本的 django-debug-toolbar
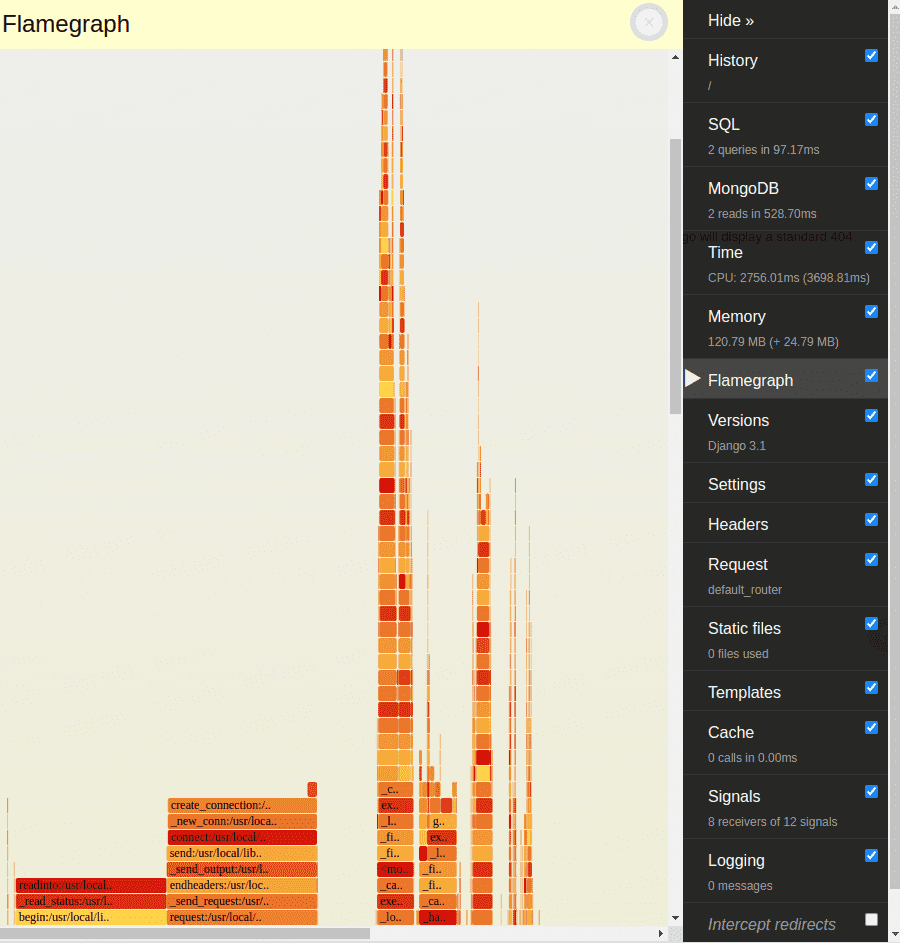
- 为了显示 Python 代码火焰图,需要合适的 pyflame 配置,需要在 docker 里面将 flamegraph.pl 暴露给
/root/third_party/flamegraph.pl这个路径,否则不能正常工作 - 为了同时支持显示 mongodb 的 sql 显示,这个 django-debug-toolbar-mongo 需要兼容旧版本的 django
django-silk
- 需要找到适配 Django 3.1 以及 python 3.6 版本的 django-silk
- 挂载 tmp 目录以便让性能分析结果持久化
- 编写中间件以便让每个接口都能进行性能分析
效果
django-debug-toolbar
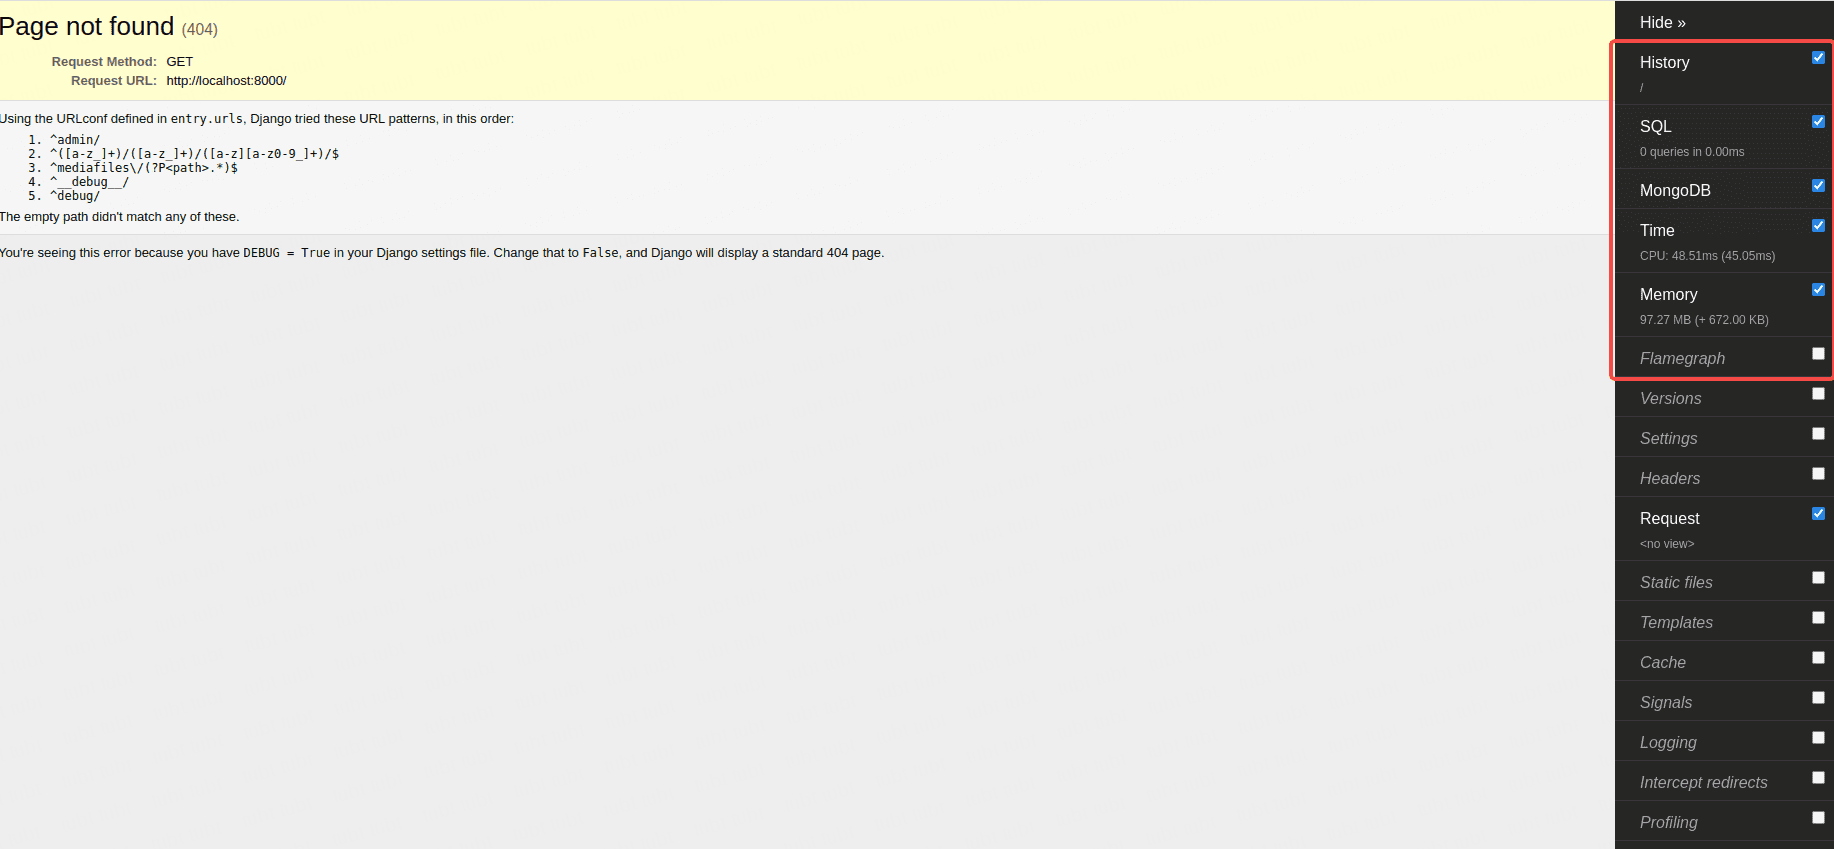
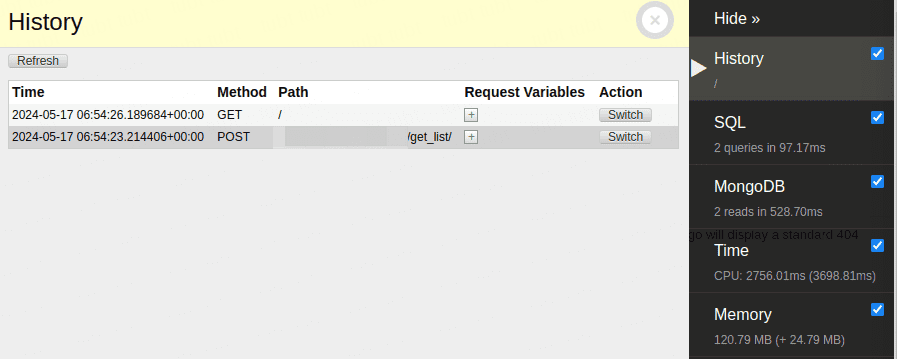
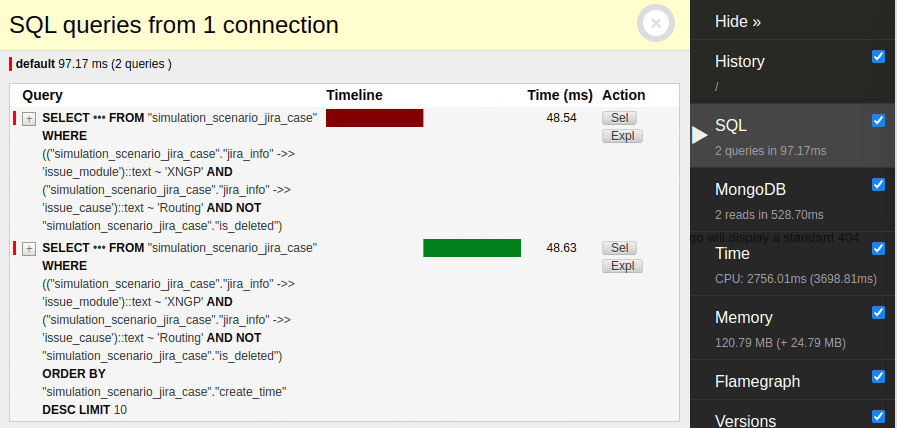
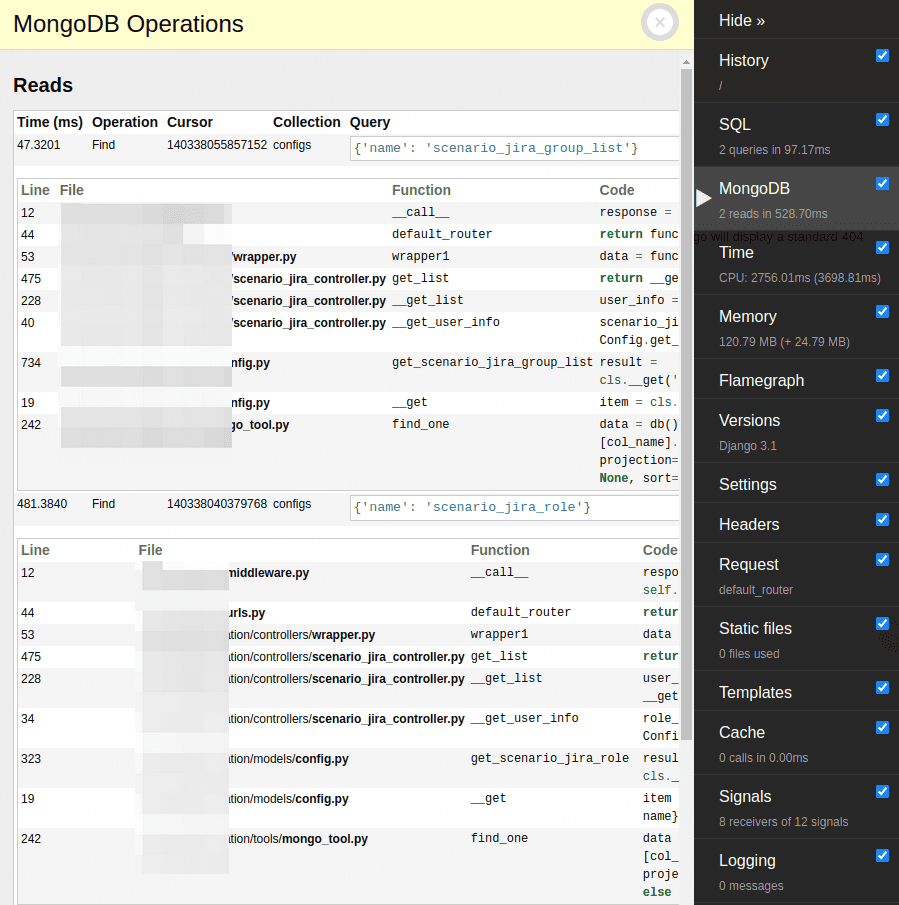
本地后端启动后,直接访问后端地址,即可看到以下常用功能:请求历史、请求涉及的 django orm sql 语句执行情况、请求涉及的 mongo sql 语句执行情况,执行时间分布、内存占用、内存调用栈
django-silk
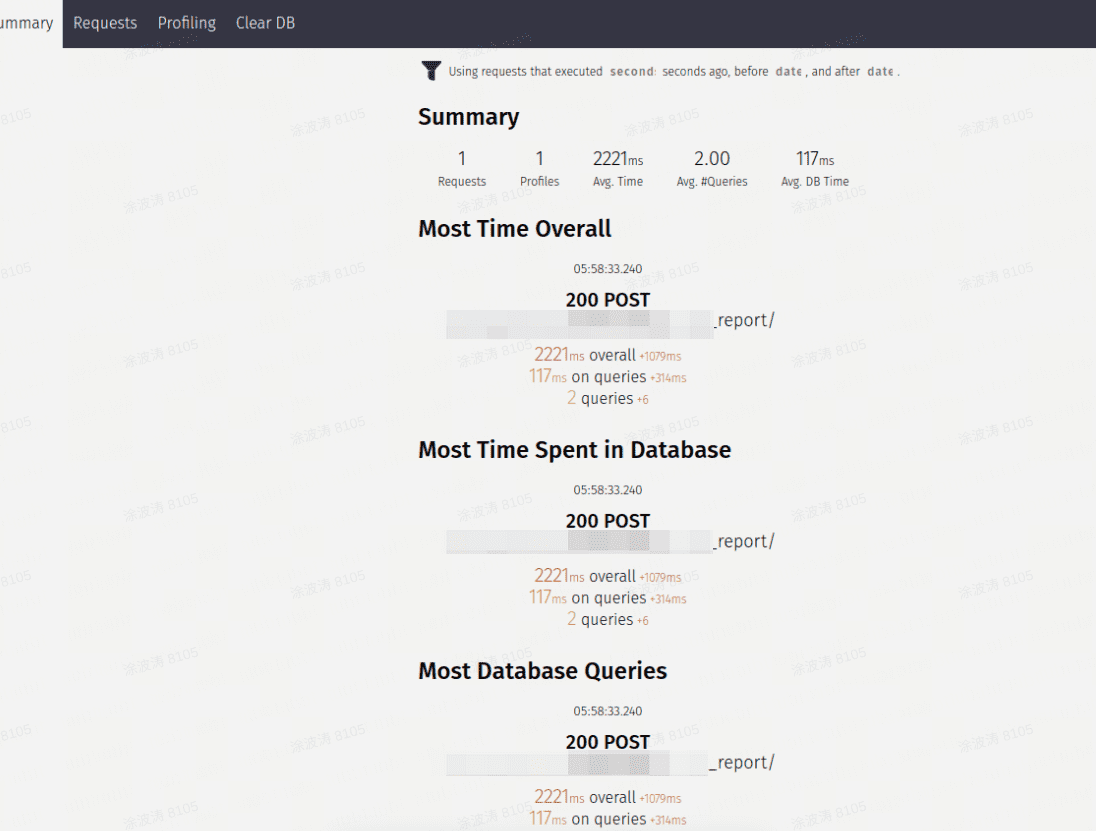
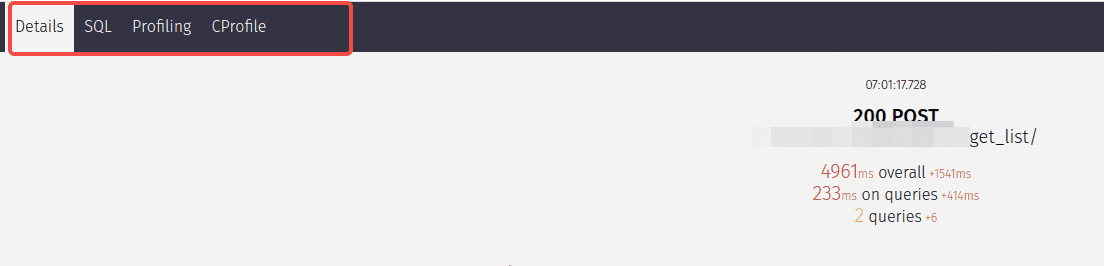
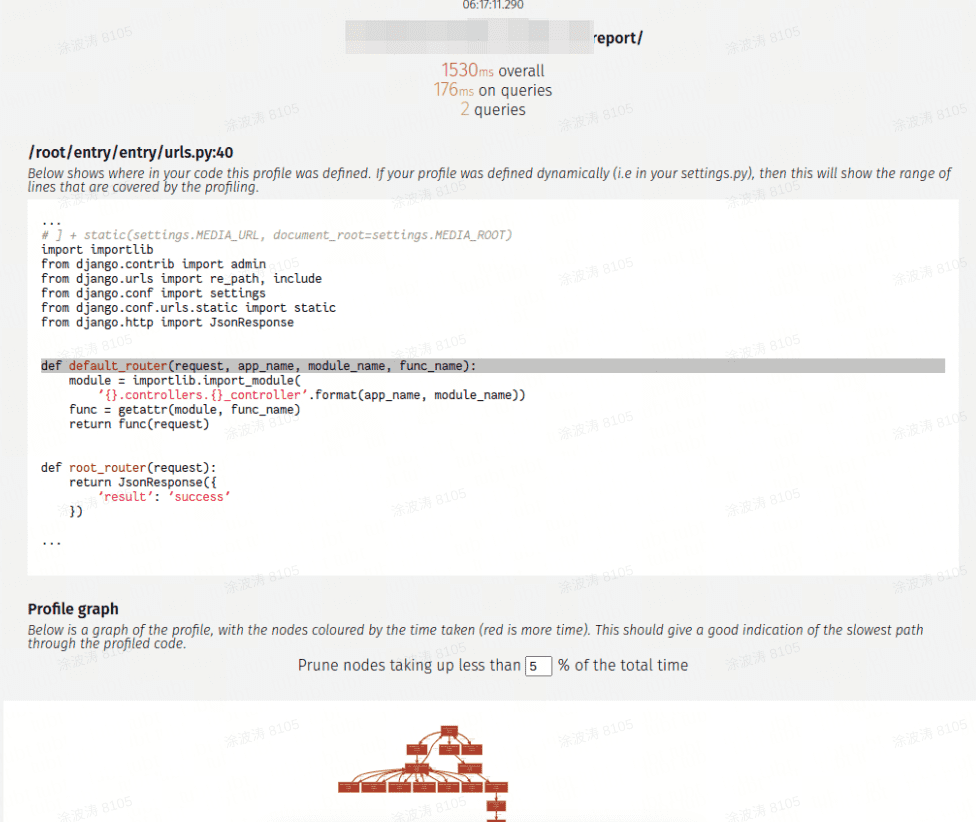
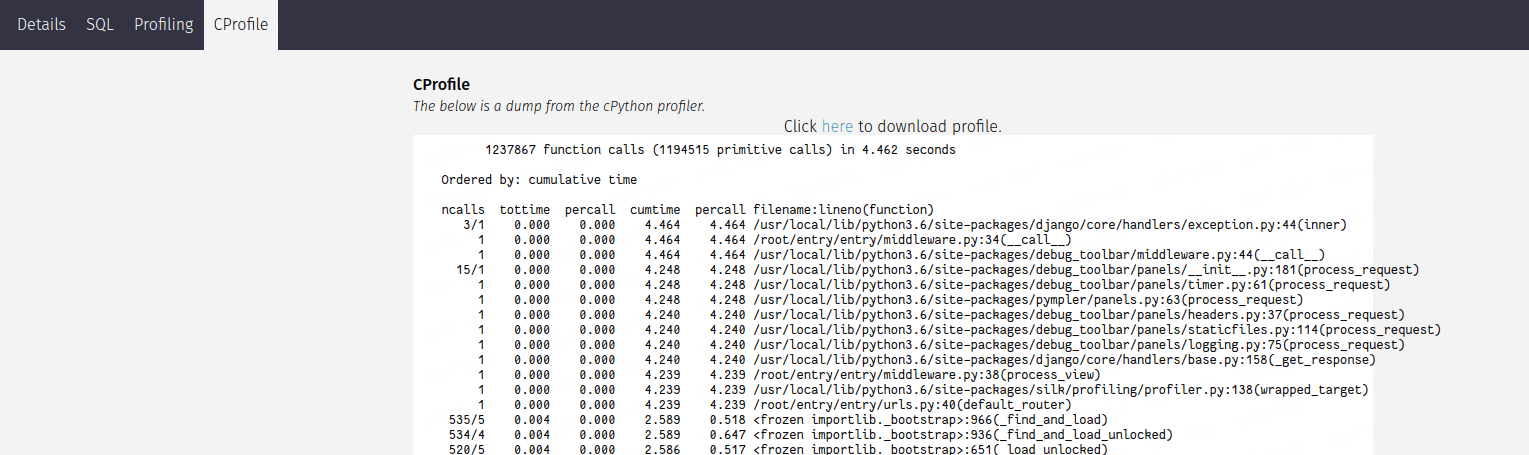
本地后端启动后,访问 后端地址 + /debug/,即可看到以下常用功能:请求概况、请求耗时、调用栈可视化、清空数据库(此功能涉及到读写 local 环境的 pg 库,如无必要请勿开启)
vscode debugger
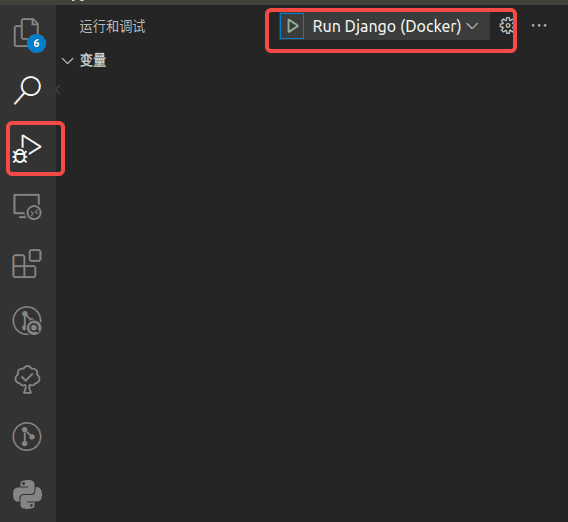
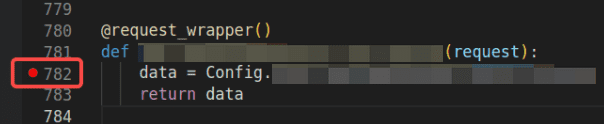
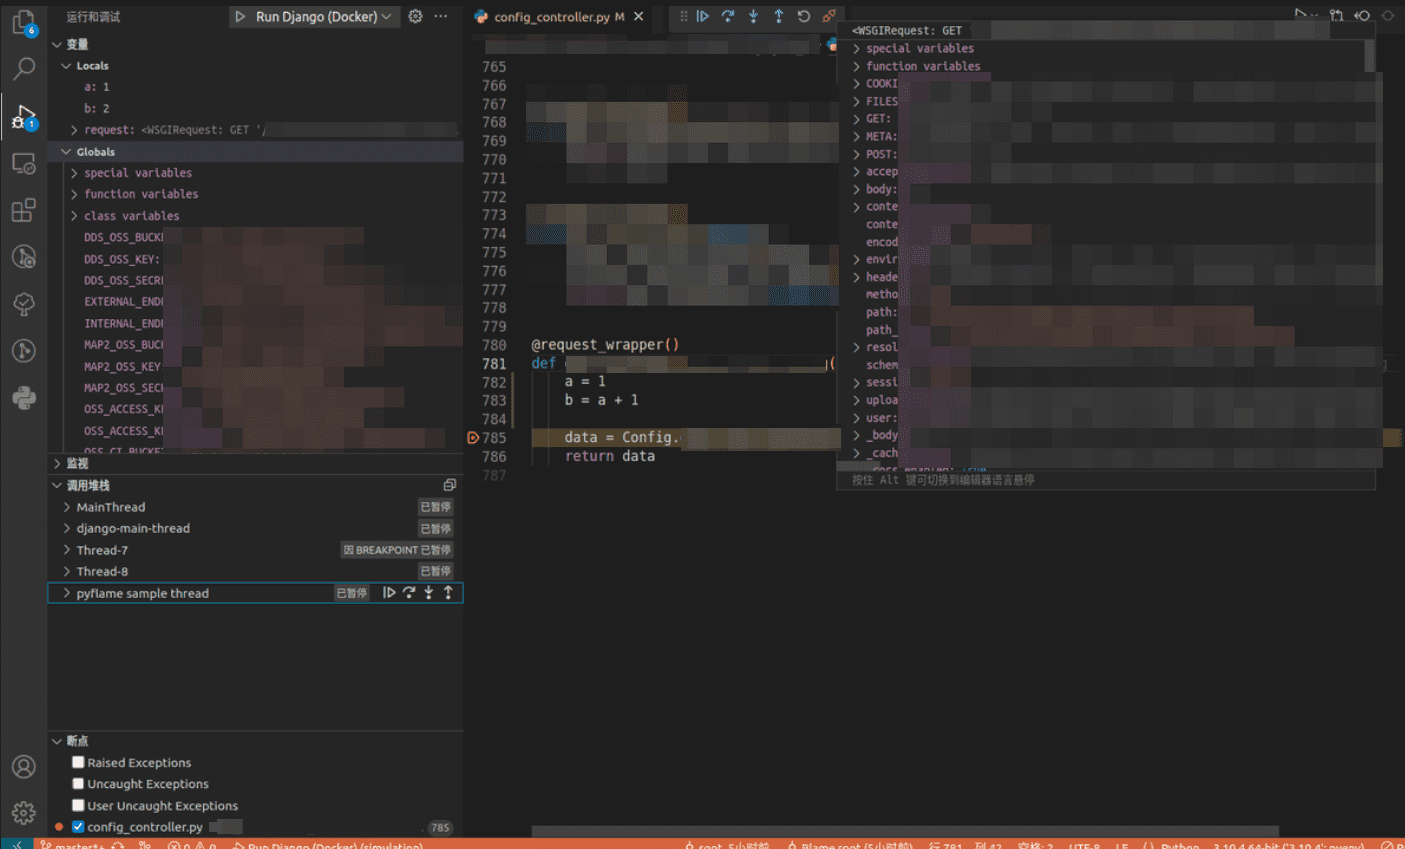
启动 vscode 调试,鼠标设置断点后,访问某个接口即可触发调试过程
flask
针对 flask 框架同样需要上面的一套后端调试工具,由于这里使用的是最近几个版本(2024-05-17 15:12:42)的 flask(2.3.3),所以不需要考虑调试工具的版本,直接使用最新版本
实现
-
安装依赖
requirements.txt
flask-debugtoolbar flask_profiler sqlalchemy -
更新主入口文件
app.py
import flask_profiler

from flask_debugtoolbar import DebugToolbarExtension

if app.debug:
  app.config['SECRET_KEY'] = '123456'
  app.config['DEBUG_TB_TEMPLATE_EDITOR_ENABLED'] = True

  app.config['DEBUG_TB_PANELS'] = (
     'flask_debugtoolbar.panels.versions.VersionDebugPanel',
     'flask_debugtoolbar.panels.timer.TimerDebugPanel',
     'flask_debugtoolbar.panels.headers.HeaderDebugPanel',
     'flask_debugtoolbar.panels.request_vars.RequestVarsDebugPanel',
     'flask_debugtoolbar.panels.config_vars.ConfigVarsDebugPanel',
     'flask_debugtoolbar.panels.template.TemplateDebugPanel',
     'flask_debugtoolbar.panels.sqlalchemy.SQLAlchemyDebugPanel',
     # 'flask_debugtoolbar.panels.logger.LoggingPanel',
     'flask_debugtoolbar.panels.route_list.RouteListDebugPanel',
     'flask_debugtoolbar.panels.profiler.ProfilerDebugPanel',
     'flask_debugtoolbar.panels.g.GDebugPanel'
  )
  # http://localhost:5001/
  DebugToolbarExtension(app)
  app.config["flask_profiler"] = {
     "enabled": True,
     "storage": {
           "engine": "sqlalchemy",
           "db_url": "sqlite:///flask_profiler.sql"
     },
     "ignore": [
           "^/static/.*",
           "^/_debug_toolbar/.*"
     ]
  }

# http://localhost:5001/flask-profiler/
if app.debug:
  flask_profiler.init_app(app)
疑难点
flask-debugtoolbar
- LoggingPanel 会影响控制台日志的打印,需要屏蔽掉
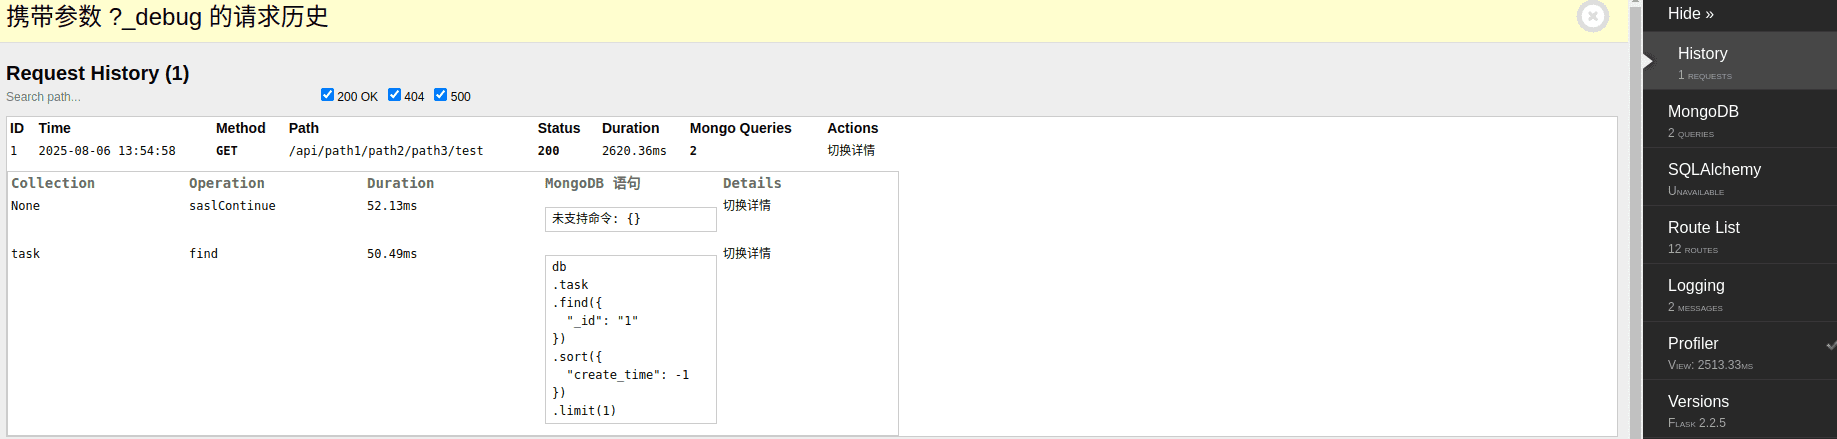
- 这里没有 history,不能看到历史请求,待预研
flask_profiler
- 需要正确配置 sqlalchemy
- 忽略 flask-debugtoolbar 插件请求
效果
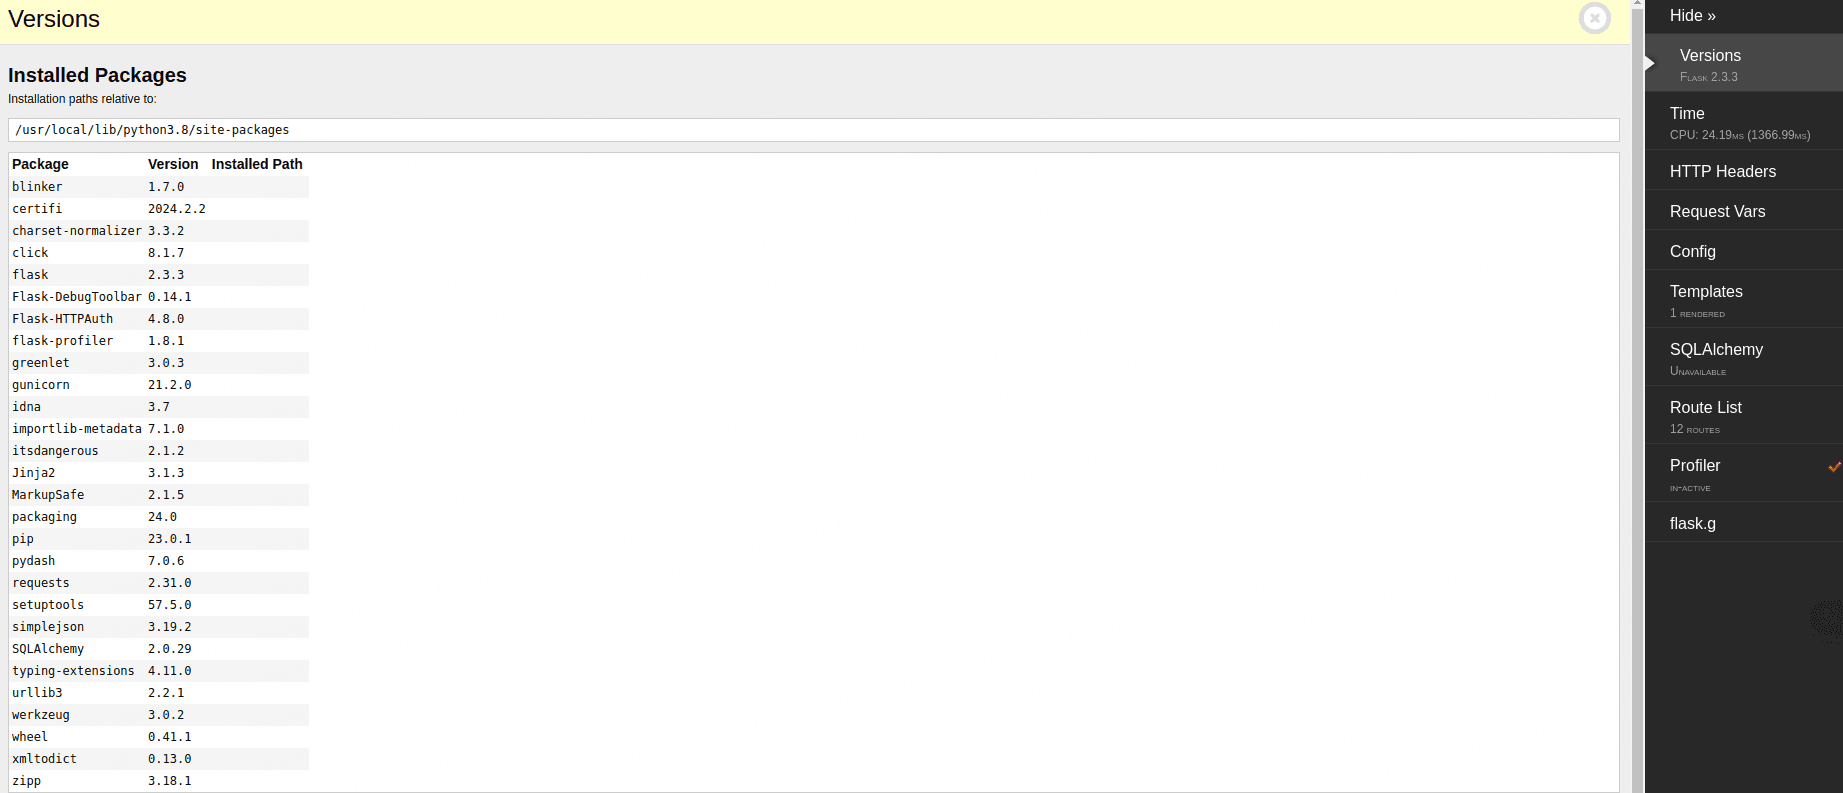
flask-debugtoolbar
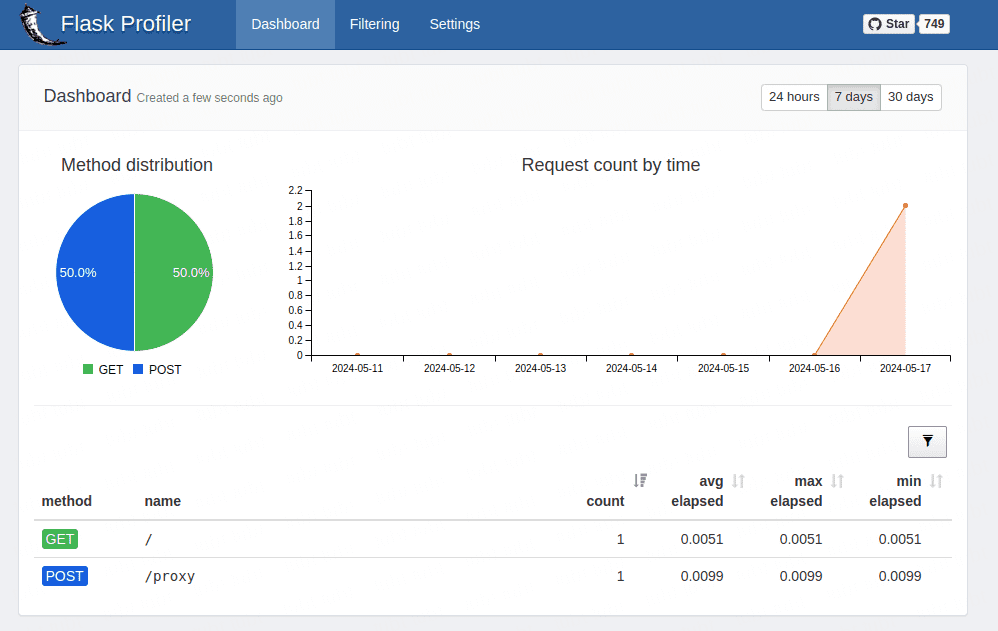
flask_profiler
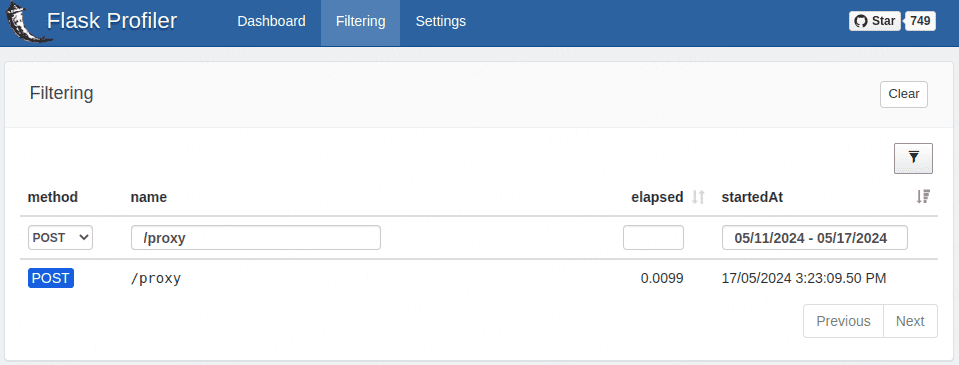
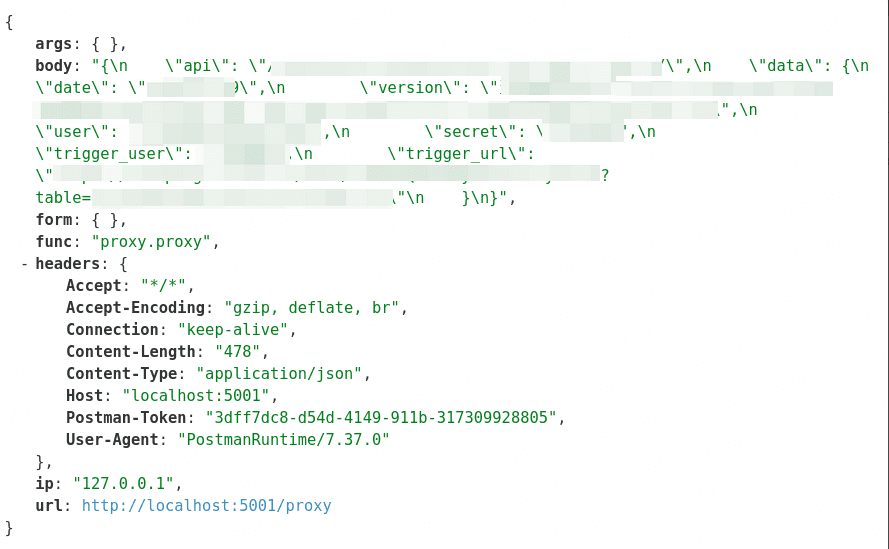
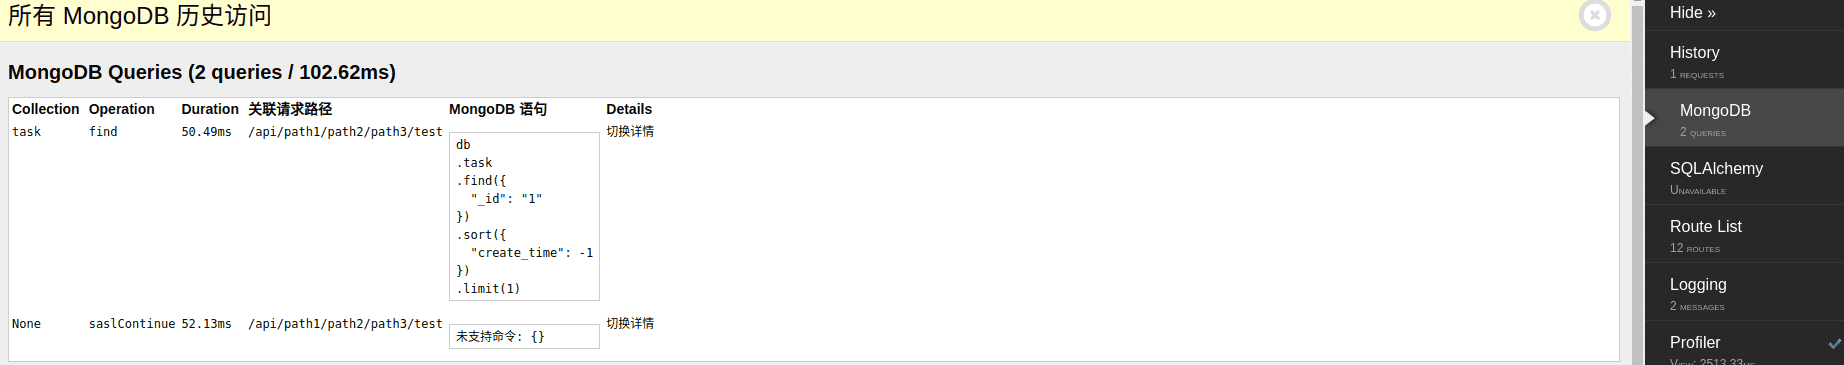
实现历史请求
实现
疑难点
- 接口并发高的情况下 flask_profiler 不可用,因为底层是 sqlite 不支持高并发写,可能要迁移到别的数据库,也可以屏蔽此插件
- flask-debugtoolbar 只能查看请求下的 mongodb 数据库访问记录,针对 sqlalchemy 的访问记录还需另外实现
效果